Function, describes a correlation or coincidence between a dependent variable () and an independent variable (). The legitimacy of this relationship between the variables is called the " correspondence rule ".
Representing a Function Verbally and with Tables
Verbal representation of a function
The verbal representation of a function expresses the connection between variables verbally, i.e. through a story.
A typical verbal representation of a function can look like this:
- Assuming that Daniel reads all the books he buys that month, the total number of books Daniel reads per year () is a function of the number of books Danny buys each month ().
Tabular representation of a function
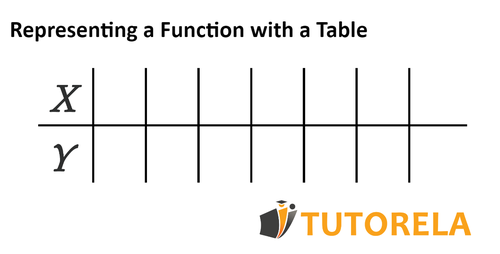
A tabular representation of a function is a demonstration of the legitimacy of a function using a table of values (independent variable) and the corresponding values (dependent variable).
In general, a table of values is shown as follows:
Test yourself on representations of functions!
Is the given graph a function?
Examples of exercises on verbal and tabular representation of a function
Example 1
is a function of that corresponds to any value of a number less than it in .
Solve the equation for each of the numbers of represented in the following table and place the correct number in. .
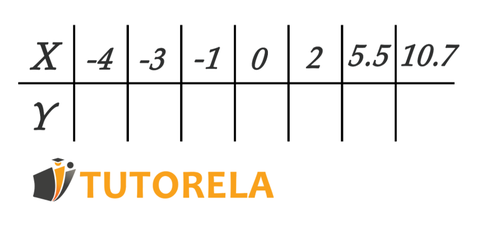
If , then Y will be equal to ____________
If , then Y will equal ___________ .
A value of corresponding to is __________
A value corresponding to is __________
Is the given graph a function?
Is the given graph a function?
Is the given graph a function?
Practice of verbal and tabular representation of a function
Example 2
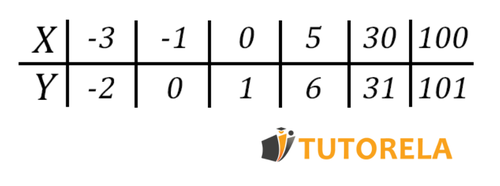
Describe in words the relationship between e .
Example 3
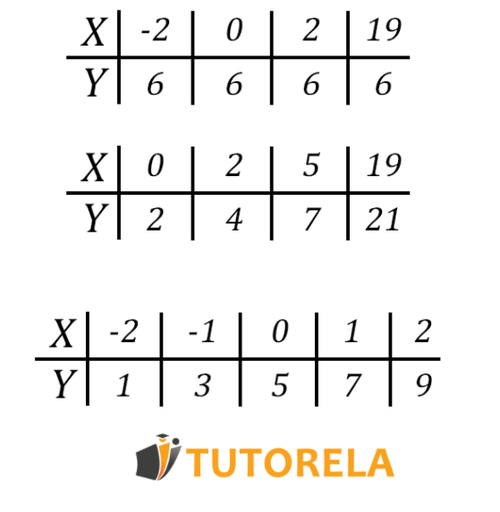
Write down which table represents a function and which table does not represent a function
Is the given graph a function?
Determine whether the given graph is a function?
Does the graph below represent a function?
Example 4
is a function of that corresponds to any value of a number that is times greater than it.
Complete the table of values
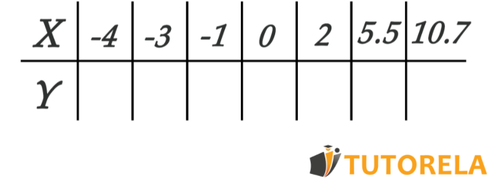
- If , then will equal ____________
- If , then will be equal to ____________
- If , then will be equal to ____________
- If , then will be equal to ____________
Example 5
is a function of that corresponds to any value of a number times less than it.
Complete the table of values

- If , then will be equal to ____________
- If , then will be equal to ____________
- If , then will be equal to ____________
- If , then will be equal to ____________
Determine whether the following table represents a constant function:
Determine whether the following table represents a function
Determine whether the following table represents a constant function
Example 6
Complete the following table

- If , then will equal ____________
- If , then will be equal to ____________
- If , then will be equal to ____________
- If , then will be equal to ____________
Example 7
Answer the following questions (for each example, write a table of values and draw the graph)
- Write an example of a function whose graph describes it as a continuous graph.
- Write an example of a function whose graph is discrete.
Determine whether the following table represents a function
Determine whether the data in the following table represent a constant function
Determine whether the following table represents a linear function
Example 8
The function corresponds to any number that is its root.
Complete the table of values

- If , then will be equal to ____________
- If , then will be equal to ____________
- If , then will be equal to ____________
- If , then will be equal to ____________
Example 9
The function corresponds to any number less than of half the number
- Complete the table of values

- If , then will be equal to ____________
- If , then will be equal to ____________
- If , then will be equal to ____________
- If , then will be equal to ____________
Which of the following equations corresponds to the function represented in the table?
Which of the following equations corresponds to the function represented in the table?
Is the given graph a function?
Example 10
The function corresponds to any number greater in times the number
- Complete the table of values

- If , then will be equal to ____________
- If , then will be equal to ____________
- If , then will be equal to ____________
- If , then will be equal to ____________
Review questions
What is a function?
A function is a relationship between two variables, the variable which is called the dependent variable, and the variable , which is called the independent variable, between these two variables there is a correspondence rule; that is, for each value of there is only one value of .
What are the ways of representing a relationship?
A function can be represented as follows:
- Verbally
- Algebraically
- Table of values (Tabular)
- Graphically.
How to represent functions step by step?
Let's see an example of how to represent a function.
Example:
Represent the following function in its different forms
- Verbally:
Let be a function of such that a value of corresponds to a number increased by
- Algebraically:
- Table of values:
We already have the function in algebraic form, now we are going to give values to , to find the value of , according to the correspondence rule, and these values we are going to register them in a table:
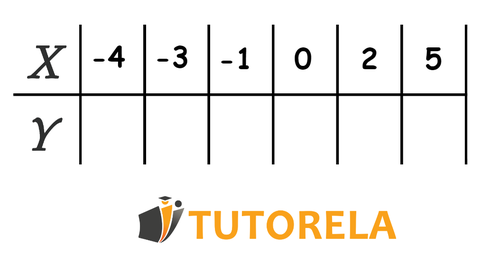
Now we are going to substitute the values of , to register the value that corresponds to , let's start with
We already know that the algebraic expression of this function is:
Then,
When
When
When
When
When
When
According to this data we are now going to record it in the table
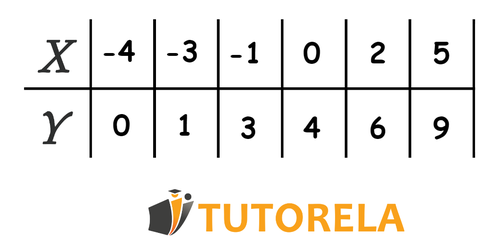
We have represented the function in a table of values.
- Graphically:
Finally we are going to represent these values in a graph:
We are going to find the pairs of coordinates in the Cartesian plane, and join each point as follows.
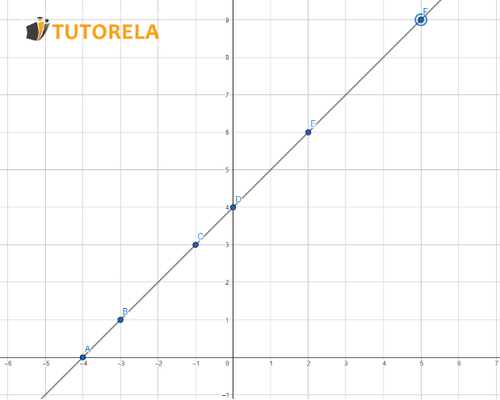
We can see that the function in graphical form is a linear function because it forms a straight line.
If you are interested in this article you may also be interested in the following articles:
Graphical representation of a function
Algebraic representation of a function
Numerical value assignment in a function
Growing and decreasing intervals of a function
In Tutorela you will find a variety of articles with interesting explanations about mathematics.
Is the given graph a function?
Is the given graph a function?
Is the given graph a function?
Examples with solutions for Representing a Function Verbally and with Tables
Exercise #1
Is the given graph a function?
Video Solution
Step-by-Step Solution
To determine if the graph is a function, we will use the Vertical Line Test.
The Vertical Line Test states that a graph represents a function if and only if no vertical line intersects the graph at more than one point.
Let's apply this test to the given graph, where a horizontal line is drawn. This line represents the function the graph should be verified against.
- Step 1: Conceptualize vertical lines passing through different x-values across the domain of the graph.
- Step 2: Observe if any of these vertical lines intersect the graph at more than one point.
Upon inspection of the graph, we see that every vertical line intersects the graph at exactly one point.
This indicates that for every input (x-value), there is a unique output (y-value), fulfilling the criteria for the definition of a function.
Therefore, according to the Vertical Line Test, the given graph is indeed a function.
The correct choice is: Yes
Answer
Yes
Exercise #2
Is the given graph a function?
Video Solution
Step-by-Step Solution
To determine whether the graph represents a function, we apply the Vertical Line Test. Here are the steps we follow:
- Step 1: Visualize placing a vertical line across various parts of the graph.
- Step 2: Check if the vertical line intersects the graph at more than one point at any given position.
Step 1: On evaluating the given graph carefully, there is a notable presence of a vertical line passing through multiple y-values. Specifically, the vertical line goes from to at .
Step 2: Since this vertical line at intersects the graph at an infinite number of points, it fails the Vertical Line Test.
Therefore, the graph does not represent a function. According to our analysis and the Vertical Line Test, the correct answer is No.
Answer
No
Exercise #3
Is the given graph a function?
Video Solution
Step-by-Step Solution
To determine if the graph in question represents a function, we'll employ the Vertical Line Test. This test helps to ascertain whether each input value from the domain (x-values) is connected to a unique output value (y-values).
- According to the Vertical Line Test, a graph represents a function if no vertical line can intersect the graph at more than one point.
- In the provided diagram, the graph is a straight line.
- Visual inspection shows that any vertical line drawn at any point along the x-axis intersects the line exactly once.
- This indicates that for each x-value, there is a unique corresponding y-value. Therefore, the relationship depicted by the graph meets the criteria for a function.
Thus, the given graph correctly characterizes a function.
Therefore, the solution to the problem is Yes.
Answer
Yes
Exercise #4
Is the given graph a function?
Video Solution
Step-by-Step Solution
To determine if the given graph represents a function, we use the vertical line test: if any vertical line intersects the graph at more than one point, the graph is not a function.
Let's apply this test to the graph:
- Examine different sections of the graph by drawing imaginary vertical lines.
- Look for intersections where more than one point exists on the vertical line.
Upon examining the graph, we observe that there are several vertical lines that intersect the graph at multiple points, particularly in areas with loops or overlapping curves. This indicates that at those -values, there are multiple -values corresponding to them.
Since there exist such vertical lines, according to the vertical line test, the graph does not represent a function.
Thus, the solution to this problem is that the given graph is not a function.
Answer
No
Exercise #5
Is the given graph a function?
Video Solution
Step-by-Step Solution
It is important to remember that a function is an equation that assigns to each element in domain X one and only one element in range Y
Let's note that in the graph:
In other words, there are two values for the same number.
Therefore, the graph is not a function.
Answer
No
More Questions
Representations of Functions
- Inequalities
- Inequalities with Absolute Value
- Algebraic Method
- Factorization: Common factor extraction
- The Extended Distributive Property
- Coordinate System
- Ordered pair
- Graphs
- Reading Graphs
- Value Table
- Discrete graph
- Continuous Graph
- Functions for Seventh Grade
- Increasing and Decreasing Intervals (Functions)
- Increasing functions
- Decreasing function
- Constant Function
- Decreasing Interval of a function
- Increasing Intervals of a function
- Domain of a Function
- Indefinite integral
- Inputing Values into a Function
- Rate of Change of a Function
- Variation of a Function
- Rate of change represented with steps in the graph of the function
- Rate of change of a function represented graphically
- Constant Rate of Change
- Variable Rate of Change
- Rate of Change of a Function Represented by a Table of Values
- Absolute Value Inequalities
- Numerical Value
- Function
- Linear Function
- Graphs of Direct Proportionality Functions
- Slope in the Function y=mx
- The Linear Function y=mx+b
- Finding a Linear Equation
- Positive and Negativity of a Linear Function
- Representation of Phenomena Using Linear Functions


