Function, describes a correlation or coincidence between a dependent variable () and an independent variable (). The legitimacy of this relationship between the variables is called the " correspondence rule ".
Function Representations Practice Problems & Worksheets
Master verbal, tabular, and algebraic function representations with step-by-step practice problems. Learn correspondence rules and complete function tables.
- Convert verbal function descriptions into algebraic expressions
- Complete function tables using correspondence rules and given equations
- Identify which tables represent valid functions vs non-functions
- Solve for missing X and Y values in function relationships
- Practice with linear, square root, and fractional function forms
- Apply function concepts to real-world scenarios and word problems
Understanding Representing a Function Verbally and with Tables
Verbal representation of a function
The verbal representation of a function expresses the connection between variables verbally, i.e. through a story.
A typical verbal representation of a function can look like this:
- Assuming that Daniel reads all the books he buys that month, the total number of books Daniel reads per year () is a function of the number of books Danny buys each month ().
Tabular representation of a function
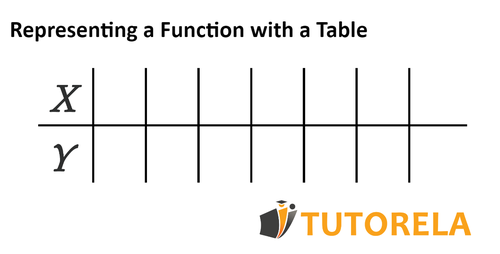
A tabular representation of a function is a demonstration of the legitimacy of a function using a table of values (independent variable) and the corresponding values (dependent variable).
In general, a table of values is shown as follows:

Practice Representing a Function Verbally and with Tables
Determine whether the following table represents a linear function
Examples with solutions for Representing a Function Verbally and with Tables
Is the given graph a function?
To determine if the graph is a function, we will use the Vertical Line Test.
The Vertical Line Test states that a graph represents a function if and only if no vertical line intersects the graph at more than one point.
Let's apply this test to the given graph, where a horizontal line is drawn. This line represents the function the graph should be verified against.
- Step 1: Conceptualize vertical lines passing through different x-values across the domain of the graph.
- Step 2: Observe if any of these vertical lines intersect the graph at more than one point.
Upon inspection of the graph, we see that every vertical line intersects the graph at exactly one point.
This indicates that for every input (x-value), there is a unique output (y-value), fulfilling the criteria for the definition of a function.
Therefore, according to the Vertical Line Test, the given graph is indeed a function.
The correct choice is: Yes
Answer:
Yes
Is the given graph a function?
To determine whether the graph represents a function, we apply the Vertical Line Test. Here are the steps we follow:
- Step 1: Visualize placing a vertical line across various parts of the graph.
- Step 2: Check if the vertical line intersects the graph at more than one point at any given position.
Step 1: On evaluating the given graph carefully, there is a notable presence of a vertical line passing through multiple y-values. Specifically, the vertical line goes from to at .
Step 2: Since this vertical line at intersects the graph at an infinite number of points, it fails the Vertical Line Test.
Therefore, the graph does not represent a function. According to our analysis and the Vertical Line Test, the correct answer is No.
Answer:
No
Is the given graph a function?
To determine if the graph in question represents a function, we'll employ the Vertical Line Test. This test helps to ascertain whether each input value from the domain (x-values) is connected to a unique output value (y-values).
- According to the Vertical Line Test, a graph represents a function if no vertical line can intersect the graph at more than one point.
- In the provided diagram, the graph is a straight line.
- Visual inspection shows that any vertical line drawn at any point along the x-axis intersects the line exactly once.
- This indicates that for each x-value, there is a unique corresponding y-value. Therefore, the relationship depicted by the graph meets the criteria for a function.
Thus, the given graph correctly characterizes a function.
Therefore, the solution to the problem is Yes.
Answer:
Yes
Is the given graph a function?
To determine if the given graph represents a function, we use the vertical line test: if any vertical line intersects the graph at more than one point, the graph is not a function.
Let's apply this test to the graph:
- Examine different sections of the graph by drawing imaginary vertical lines.
- Look for intersections where more than one point exists on the vertical line.
Upon examining the graph, we observe that there are several vertical lines that intersect the graph at multiple points, particularly in areas with loops or overlapping curves. This indicates that at those -values, there are multiple -values corresponding to them.
Since there exist such vertical lines, according to the vertical line test, the graph does not represent a function.
Thus, the solution to this problem is that the given graph is not a function.
Answer:
No
Is the given graph a function?
It is important to remember that a function is an equation that assigns to each element in domain X one and only one element in range Y
Let's note that in the graph:
In other words, there are two values for the same number.
Therefore, the graph is not a function.
Answer:
No