Constant Rate of Change

🏆Practice variation of a function

Constant Rate of Change

The meaning of the constant rate of change of a function can be seen when the variables X X change in fixed proportions and the Y Y do as well. 

For example, if the constant interval of the X X is 2 2 and also that of the Y Y is stable and does not vary from time to time.
The interval of the Y Y variables does not necessarily have to be equal to that of the X X for it to be considered a case of constant rate of change.
If the function is represented with a straight graph, it means that the rate of change is constant.
The rate of change is the slope of the function.

A constant rate of change is represented by a straight line, as seen in the following scheme:
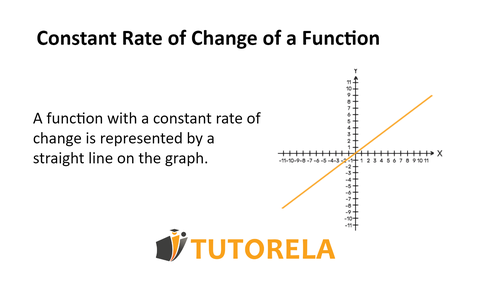
A2 - Constant rate of change of a function

Start practice

Test yourself on variation of a function!

einstein

Given the following graph, determine whether function is constant

–9–9–9–8–8–8–7–7–7–6–6–6–5–5–5–4–4–4–3–3–3–2–2–2–1–1–1111222333444555666777888999–4–4–4–3–3–3–2–2–2–1–1–1111222333444555666000

Practice more now

How can one identify the constant rate of change?

Let's see, the rate of change is constant if the following is true:

that when the variable X X increases from 4 4 to 5 5
and the Y Y increases by 8 8

then, when the variable X X grows from 102 102 to 103 103
also the Y Y increases by 8 8

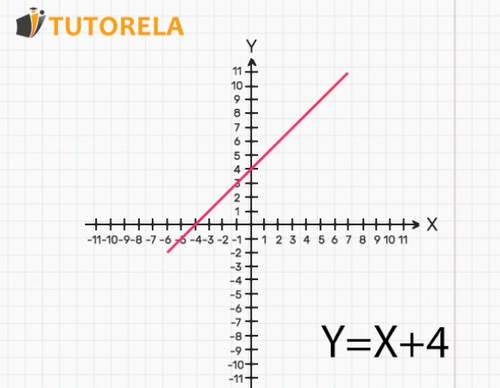
Graph of the constant rate of change

Graph of the constant rate of change

Constant rate of change of a function


Join Over 30,000 Students Excelling in Math!
Endless Practice, Expert Guidance - Elevate Your Math Skills Today
Test your knowledge

Table of Constant Rate of Change

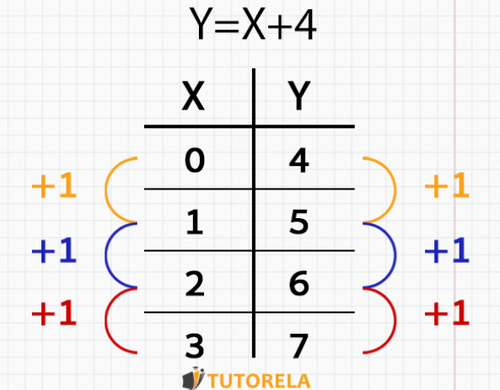
Table of constant rate of change

Representation of the function in table


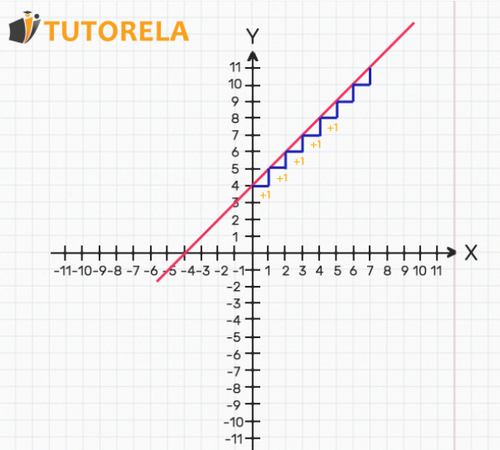
Step graph of the constant rate of change

Step graph of constant rate of change


If you are interested in this article, you might also be interested in the following articles:

Rate of change of a function

Rate of change of a function represented graphically

Rate of change of a function represented by a table of values

Variable rate of change

Rate of change represented with steps in the function's graph

In the blog of Tutorela you will find a variety of articles with interesting explanations about mathematics


Examples and exercises with solutions of constant rate of change

Exercise #1

Given the following graph, determine whether the rate of change is uniform or not

111222333444555666777888999101010111111121212131313141414151515111222333444555666777888000

Video Solution

Step-by-Step Solution

Let's remember that if the function is not a straight line, its rate of change is not uniform.

Since the graph is not a straight line - the rate of change is not uniform.

Answer

Non-uniform

Exercise #2

Given the following graph, determine whether the rate of change is uniform or not

–5–5–5–4–4–4–3–3–3–2–2–2–1–1–1111222333444555666777888999101010111111–3–3–3–2–2–2–1–1–1111222333444555000

Video Solution

Step-by-Step Solution

Let's remember that if the function is not a straight line, its rate of change is not uniform.

Since the graph is not a straight line - the rate of change is not uniform.

Answer

Non-uniform

Exercise #3

Given the following graph, determine whether the rate of change is uniform or not

–8–8–8–7–7–7–6–6–6–5–5–5–4–4–4–3–3–3–2–2–2–1–1–1111222333444555666777888–3–3–3–2–2–2–1–1–1111222333444555666000

Video Solution

Step-by-Step Solution

Remember that if the function is a straight line, its rate of change will be constant.

Since the graph is a straight line - the rate of change is constant.

Answer

Uniform

Exercise #4

Look at the graph below and determine whether the function's rate of change is constant or not:

–5–5–5–4–4–4–3–3–3–2–2–2–1–1–1111222333444555666777888999101010111111–3–3–3–2–2–2–1–1–1111222333444555000

Video Solution

Step-by-Step Solution

First we need to remember that if the function is not a straight line, its rate of change is not constant.

The rate of change is not uniform since the function is not a straight line.

Answer

Not constant

Exercise #5

Given the following graph, determine whether function is constant

–9–9–9–8–8–8–7–7–7–6–6–6–5–5–5–4–4–4–3–3–3–2–2–2–1–1–1111222333444555666777888999–4–4–4–3–3–3–2–2–2–1–1–1111222333444555666000

Video Solution

Answer

constant

Do you know what the answer is?
Start practice