Functions can be represented in several ways, each providing a unique perspective on the relationship between inputs and outputs. Here are the primary methods:
Ways to Represent a Function
Ways to represent a function
Algebraic Representation
Representation using an equation of and , such as , showing how the output depends on the input.
Graphical representation
A visual representation on a coordinate plane, like using a graph, plotting on the and axis, where the function's behavior and trends (e.g., linear, quadratic) can be observed.
Tabular representation
A table of values that pairs inputs () with corresponding outputs () for a quick reference of specific points.
Verbal representation
A written explanation describing the relationship between variables, such as “The output is twice the input plus three.” Expressing the relationship between and using words.
Function notation
Test yourself on representations of functions!

Determine whether the data in the following table represent a constant function
Ways to represent a function
Algebraic representation of a function
Before we talk about algebraic representation, it is important to understand what a function means.
A function describes the relationship between and .
In any function, is the independent variable and is the dependent variable. This means that every time we change , we get a different .
Y depends on and depends on nothing.
Important point: For each there will be only one !
An algebraic representation of a function is essentially the equation of the function.
Let's look at some examples of algebraic representation of a function and analyze them:
In this equation, it is clear that depends on the we substitute into the equation.
If , then
If , then
If , then
In other words, the relationship between and is that will always be less than .
Now let's examine another equation:
Also in this equation, it is clear that depends on the we substitute into the equation.
If , then
If , then
If , then
In this equation, it is difficult to define in words the relationship between and , so we will say that the relationship between them is the equation itself:
Now let's examine another equation:
In this equation, it is also clear that depends on the we substitute into the equation.
If , then
If , then
If , then
The relationship between and is that they are identical each time.
Click here to learn more about the algebraic representation of a function!
Graphical representation of a function
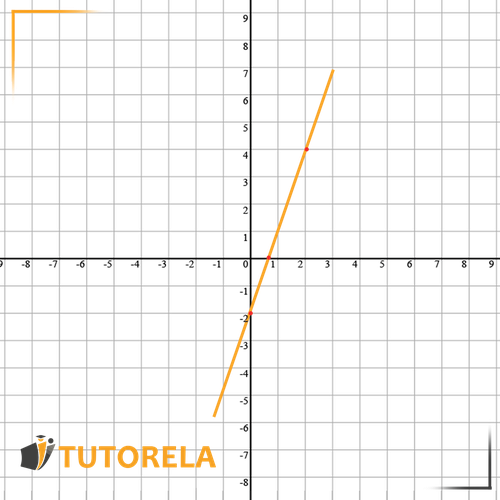
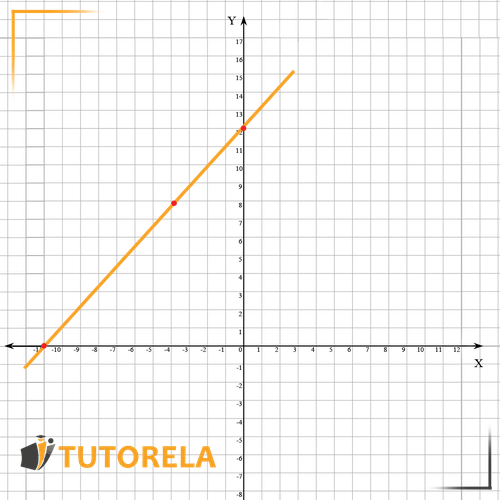
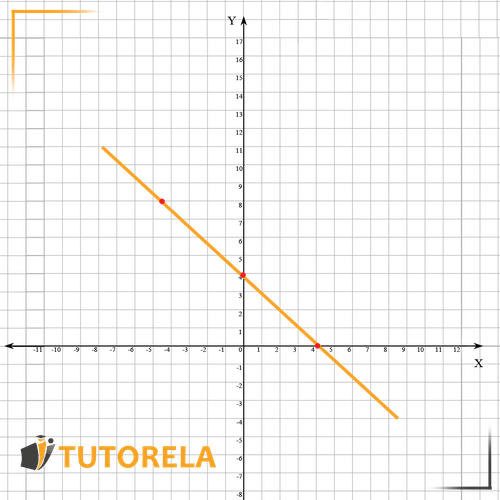
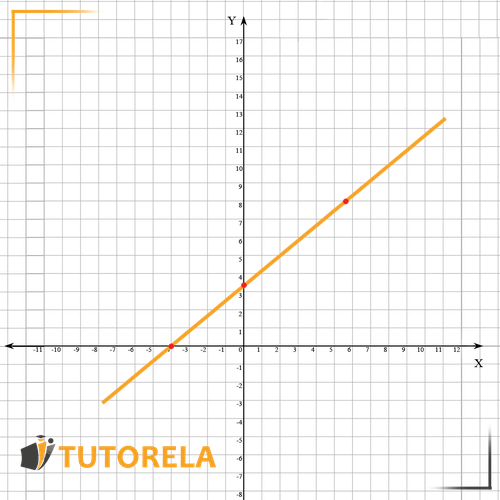
A graphical representation of a function shows us how the function looks on the and axes.
What is most important to know?
For each , there is only one , and to draw a function as a graph, it is advisable to find at least 3 points of the function.
How to draw the function:
Each time, substitute a different into the algebraic representation and identify its . Mark all the points obtained on the drawing and then draw a straight line between them.
For example:
Let's substitute three s and we get:
| 0 | -2 |
| 2 |
Now let's mark the points we obtained on the number line:

Examples of graphical representation of a function:


Important tips:
How do you know if the function is increasing or decreasing?
There are 2 ways:
- According to the coefficient of in the algebraic representation – if the coefficient of is positive, the function increases from left to right. If negative, the function decreases from left to right.
- Mark points of the function (substitute a different each time and find the ) and then draw a straight line passing through them. Look from left to right and decide if the function is increasing or decreasing.
You can read more about the graphical representation of a function at this link!
Determine whether the following table represents a function
Determine whether the following table represents a function
Determine whether the following table represents a function
Tabular representation of a function
A tabular representation is essentially a representation using a table of and showing us the value of for each that we substitute into the function.
Let's see an example:
For the algebraic representation -
we get a tabular representation like this:
Verbal representation of a function
A verbal representation of a function describes the relationship between and using words.
For example:
Each package of flour () makes whole pizzas ()
For more information on verbal and tabular representation of a function, click here!
Determine whether the given graph is a function?
Does the graph below represent a function?
Is the given graph a function?
Function notation
How do we denote a function?
So far, we have denoted a function as
It is also useful to know that a function can be denoted in the following way:
which implies that we will get a value that depends on .
You can read more about function notation here!
Is the given graph a function?
Is the given graph a function?
Is the given graph a function?
Examples with solutions for Representations of Functions
Exercise #1
Determine whether the data in the following table represent a constant function
Video Solution
Step-by-Step Solution
It is important to remember that a constant function describes a situation where as the X value increases, the function value (Y) remains constant.
In the table, we can observe that there is a constant change in X values, meaning an increase of 1, and a non-constant change in Y values - sometimes increasing by 1 and sometimes by 4
Therefore, according to the rule, the table does not describe a function
Answer
No
Exercise #2
Determine whether the following table represents a function
Video Solution
Step-by-Step Solution
It is important to remember that a constant function describes a situation where as the X value increases, the function value (Y) remains constant.
In the table, we can observe that there is a constant change in X values, meaning an increase of 1, and a constant change in Y values, meaning an increase of 3
Therefore, according to the rule, the table describes a function.
Answer
Yes
Exercise #3
Determine whether the given graph is a function?
Video Solution
Step-by-Step Solution
It is important to remember that a function is an equation that assigns to each element in domain X one and only one element in range Y
We should note that for every X value found on the graph, there is one and only one corresponding Y value.
Therefore, the graph is indeed a function.
Answer
Yes
Exercise #4
Does the graph below represent a function?
Video Solution
Step-by-Step Solution
It is important to remember that a function is an equation that assigns to each value in domain only one value in range .
Since we can see that for every value found on the graph there is only one corresponding value, the graph is indeed a function.
Answer
Yes
Exercise #5
Is the given graph a function?
Video Solution
Step-by-Step Solution
It is important to remember that a function is an equation that assigns to each element in domain X one and only one element in range Y
Let's note that in the graph:
In other words, there are two values for the same number.
Therefore, the graph is not a function.
Answer
No
More Questions
- Inequalities
- Inequalities with Absolute Value
- Algebraic Method
- Factorization: Common factor extraction
- The Extended Distributive Property
- Coordinate System
- Ordered pair
- Graphs
- Reading Graphs
- Value Table
- Discrete graph
- Continuous Graph
- Functions for Seventh Grade
- Increasing and Decreasing Intervals (Functions)
- Increasing functions
- Decreasing function
- Constant Function
- Decreasing Interval of a function
- Increasing Intervals of a function
- Domain of a Function
- Indefinite integral
- Inputing Values into a Function
- Rate of Change of a Function
- Variation of a Function
- Rate of change represented with steps in the graph of the function
- Rate of change of a function represented graphically
- Constant Rate of Change
- Variable Rate of Change
- Rate of Change of a Function Represented by a Table of Values
- Absolute Value Inequalities
- Numerical Value
- Function
- Linear Function
- Graphs of Direct Proportionality Functions
- Slope in the Function y=mx
- The Linear Function y=mx+b
- Finding a Linear Equation
- Positive and Negativity of a Linear Function
- Representation of Phenomena Using Linear Functions


