Constant Function

🏆Practice increasing and decreasing intervals of a function

We will say that a function is constant when, as the value of the independent variable X X increases, the dependent variable Y Y remains the same.

Let's assume we have two elements X X , which we will call X1 X1 and X2 X2 , where the following is true: X1<X2 X1<X2 , that is, X2 X2 is located to the right of X1 X1 .

  • When X1 X1 is placed in the domain, the value Y1 Y1 is obtained.
  • When X2 X2 is placed in the domain, the value Y2Y2 is obtained.


The function is constant when: X2>X1 X2>X1 and also \(Y2=Y1).

The function can be constant in intervals or throughout its domain.

Constant Function

Constant Function

Start practice

Test yourself on increasing and decreasing intervals of a function!

Does the function in the graph decrease throughout?

YYYXXX

Practice more now

Constant Function Exercises

Exercise 1

Assignment

Find the decreasing and increasing area of the function

f(x)=5x225 f(x)=5x^2-25

Solution

In the first step, let's consider that a=5 a=5

Therefore a>0 a>0 and the parabola is at the minimum

In the second step, we find x x of the vertex

according to the data we know:

a=5,b=0,c=25 a=5,b=0,c=-25

We replace the data in the formula:

x=b2a x=\frac{-b}{2\cdot a}

x=025 x=\frac{-0}{2\cdot5}

x=010 x=\frac{-0}{10}

x=0 x=0

Answer

x<0 x<0 Decreasing

0<x 0<x Increasing


Join Over 30,000 Students Excelling in Math!
Endless Practice, Expert Guidance - Elevate Your Math Skills Today
Test your knowledge

Exercise 2

Assignment

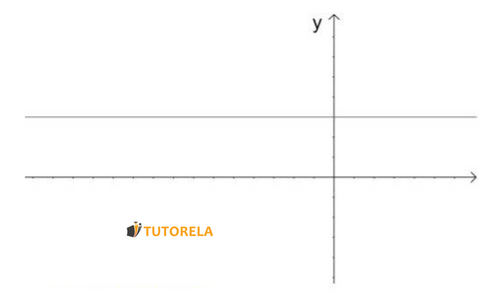
Given the linear function of the graph

What is the domain of negativity of the function?

the function is always above the x-axis

Solution

Keep in mind that the function is always above the axis: x x

That is, the function is always positive and has no negative domain. Therefore, no x x

Answer

The function is always positive


Exercise 3

Assignment

Find the increasing area of the function

f(x)=6x212 f(x)=6x^2-12

Solution

In the first step, let's consider that a=6 a=6

Therefore a>0 a>0 and the parabola is a minimum

In the second step, we find x x of the vertex

according to the data we know that:

a=6,b=0,c=12 a=6,b=0,c=-12

We replace the data in the formula

x=b2a x=\frac{-b}{2\cdot a}

x=026 x=\frac{-0}{2\cdot6}

x=012 x=\frac{0}{12}

x=0 x=0

Therefore

0<x 0<x Increasing

x<0 x<0 Decreasing

Answer

0<x 0<x


Do you know what the answer is?

Exercise 4

Assignment

To find the increasing and decreasing area of the function, you need to find the intersection point of the vertex

Answer

True


Exercise 5

Assignment

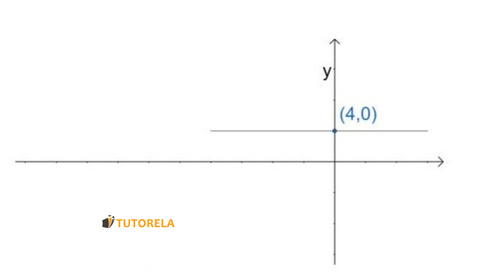
Given the function in the diagram, what is its domain of positivity?

what is its domain of positivity

Solution

Note that the entire function is always above the axis: x x

Therefore, it will always be positive. Its area of positivity will be for all x x

Answer

For all x x


Check your understanding

Examples with solutions for Constant Function

Exercise #1

Does the function in the graph decrease throughout?

YYYXXX

Step-by-Step Solution

To solve this problem, we'll begin by examining the graph of the function provided:

  • Step 1: Observe the graph from left to right along the x-axis.
  • Step 2: Look for any intervals where the function value (y-coordinate) does not decrease as the x-value increases.
  • Step 3: Pay special attention to segments where the graph might look horizontal or rising.

Upon inspecting the graph, we find:

- There are sections where the function's y-values appear to remain constant or potentially rise as the x-values increase. Specifically, even if the function decreases in major portions, any interval where it doesn't means the function cannot be classified as decreasing throughout.

Thus, the function does not strictly decrease on the entire interval shown. Therefore, the solution to the problem is No.

Answer

No

Exercise #2

Is the function in the graph below decreasing?

yx

Step-by-Step Solution

To determine if the function is decreasing, we will analyze the graph visually:

The graph shows a line connecting from the bottom-left to the top-right of the graph area, indicating the line has a positive slope. This type of graph indicates the function is increasing, not decreasing.

A decreasing function means its value goes down as x x increases, which is equivalent to having a negative slope.

Since the graph appears with a positive slope, the function is not decreasing.

Thus, the correct choice to the problem, which asks if the function in the graph is decreasing, is No.

Answer

No

Exercise #3

Is the function in the graph decreasing?

yx

Step-by-Step Solution

To analyze whether the function in the graph is decreasing, we must understand how the function's behavior is defined by its graph:

  • Step 1: Examine the graph. The graph presented is a horizontal line.
  • Step 2: Recognize the properties of a horizontal line. Horizontally aligned lines correspond to constant functions because the y y -value remains the same for all x x -values.
  • Step 3: Define the criteria for a function to be decreasing. A function decreases when, as x x increases, the value of f(x) f(x) decreases.
  • Step 4: Apply this criterion to the horizontal line. Since the y y -value is constant and does not decrease as x x moves rightward, the function is not decreasing.

Therefore, the function represented by the graph is not decreasing.

Answer

No

Exercise #4

Is the function in the graph decreasing? yx

Step-by-Step Solution

To solve this problem, we'll follow these steps:

  • Step 1: Verify the graph's overall path direction
  • Step 2: Confirm if the y-values are decreasing as we proceed from the left side of the graph to the right side (increasing x-values).

Now, let's work through each step:

Step 1: By examining the graph, the red line starts at a higher point on the y-axis and moves downward to a lower point as it moves horizontally across the x-axis from left to right.

Step 2: Since for every point, the red line descends as it progresses from the leftmost point to the rightmost, this indicates a consistent decrease in the y-values.

Therefore, the solution to the problem is Yes, the function in the graph is decreasing.

Answer

Yes

Exercise #5

Is the function shown in the graph below decreasing?

yx

Step-by-Step Solution

To solve this problem, we'll follow these steps:

  • Step 1: Visually inspect the graph to see if it is consistently sloping downward.
  • Step 2: Apply the definition of a decreasing function.

Now, let's work through each step:
Step 1: Observing the graph, the function's graph is a line moving from the top left to the bottom right. This indicates it slopes downward as we move from left to right across the x x -axis.
Step 2: According to the definition of a decreasing function, for any x1<x2 x_1 < x_2 , it must hold true that f(x1)>f(x2) f(x_1) > f(x_2) . Since the graph shows a line moving downward, this condition is satisfied throughout its domain.

Therefore, the function represented by the graph is indeed decreasing.

The final answer is Yes.

Answer

Yes

Start practice