Rate of change represented by steps in the function graph
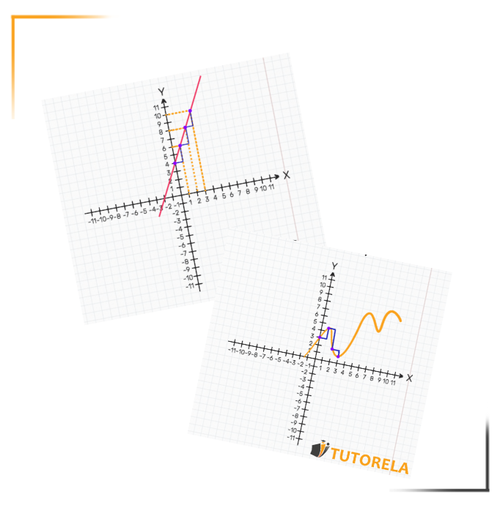
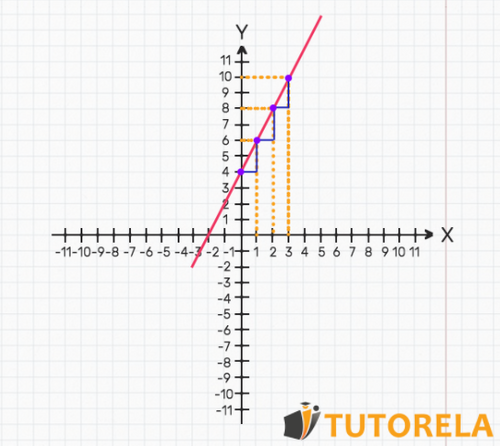
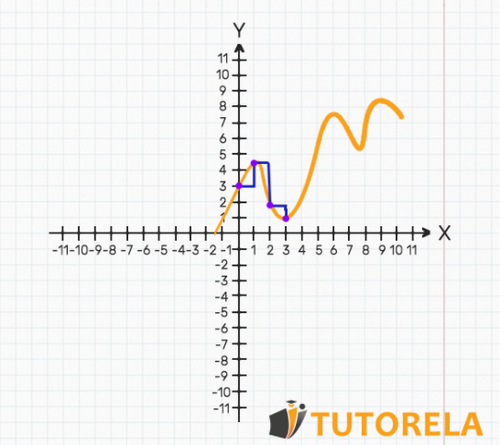
We can draw stairs on the graph of the function to see the rate of change.
The base of the step will represent the interval in the variables and the height will symbolize the interval in the .
The step will mark the "jump" from in relation to the "jump" in .
The bases of the steps will always be the same since we always choose fixed intervals in .
- If the heights of the steps are increasing, it means that the rate of change is increasing.
- If the heights of the steps are decreasing, it means that the rate of change is decreasing.
- If the heights of the steps do not change, it means that the rate of change is constant.


