The continuous graph is the classic version of what we call a "graph", and it is a very important topic that reappears in almost all mathematics subjects.
Continuous Graph
What is a continuous graph?
A continuous graph is a linear graph that describes the continuity of numbers along the X horizontal axis.
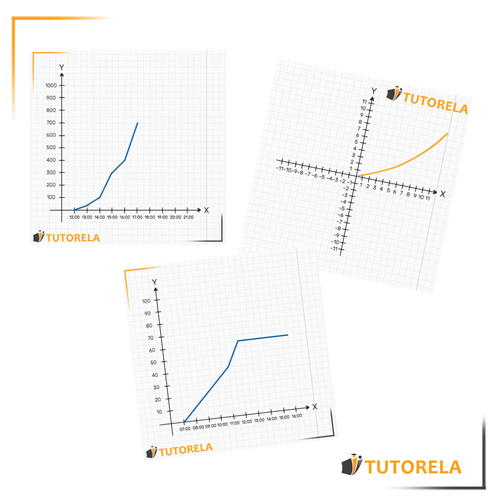
Each point on the continuous graph can be represented by an ordered pair where the left value in parentheses represents the numerical value of the horizontal axis, while the right value in parentheses represents the numerical value of the vertical axis.
Below is an example of a continuous graph
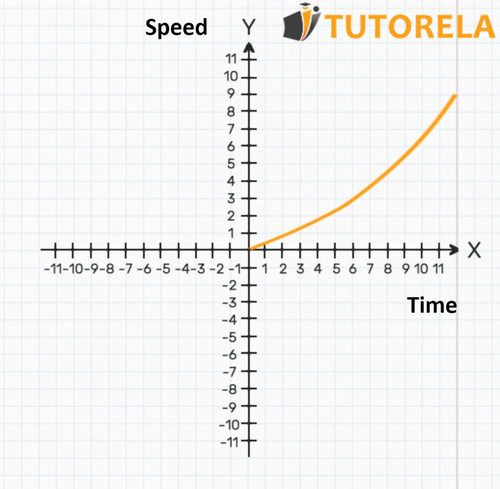
- In this graph, the axis represents time, while the axis represents speed.
- The axis represents a continuous value of time and we observe in the graph how the speed changes as a function of time.
Sometimes graphs seem complicated, but if we understand how they work, we will see that they are actually very simple. A graph is just a way to show a lot of information at once.
We have several basic types of graphs. In this article, we will learn about discrete graphs
Another and different example
Example 1
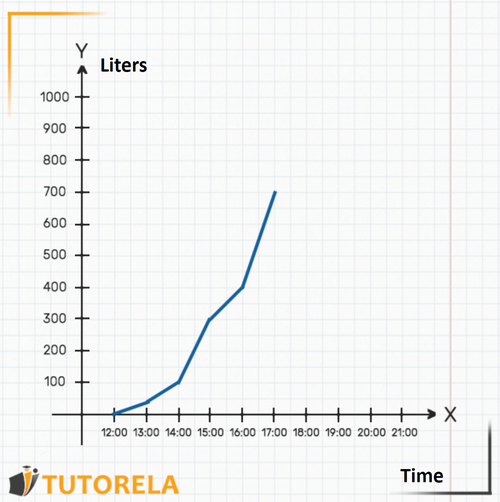
Every graph is composed of two axes: the axis and the axis. The axis is the horizontal one (we can imagine it as the floor of the graph). In this graph, the axis will indicate the time. That is, as we move along the axis, the time will advance.
For example, you will be able to identify where the hour is, then (to its right), the and so on.
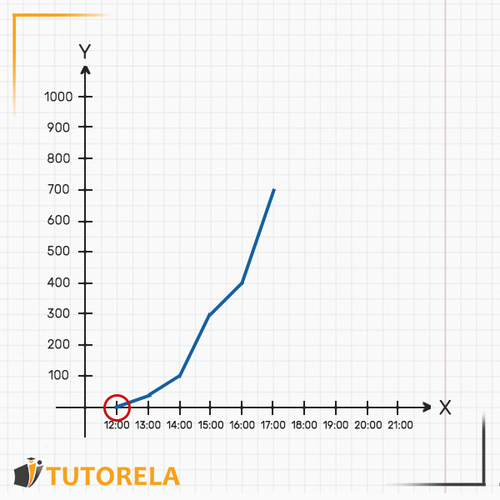
The axis is the vertical one (we can imagine it as the wall of the graph). In this case, it represents the amount of water in liters that is in the pool at each moment.
With the two axes, this graph describes the amount of water that is in the pool as the hours go by. That is, the pool is being filled with water over time, and the graph shows the amount of water at each given moment.
Sometimes graphs seem complicated, but if we understand how they work, we will see that, in reality, they are very simple. A graph is just a way to show a lot of information at once.
We have several basic types of graphs. In this article, we will get to know the continuous graph, learn how to read it, and how to draw it.
Example 1: (We will continue with the last example)

Every graph is composed of two axes: the axis and the axis. The axis is the horizontal one (we can imagine it as the floor of the graph). In this graph, the axis will indicate the time. That is, as we move along the axis, the time will advance. For example, you can identify where the mark is, then (to its right), the mark, and so on.
The axis is the vertical one (we can imagine it as the wall of the graph). In this case, it represents the amount of water in liters that is in the pool at each moment.
With the two axes, this graph describes the amount of water in the pool as the hours pass. That is, the pool is being filled with water over time, and the graph shows the amount of water at each given moment.
Try to deduce:
- How many liters were in the pool at ?
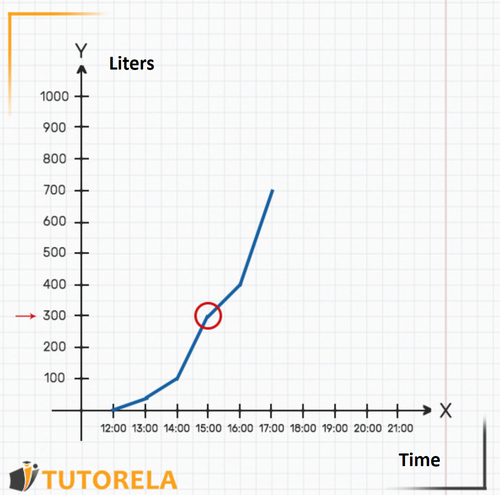
- When were there exactly liters in the pool?
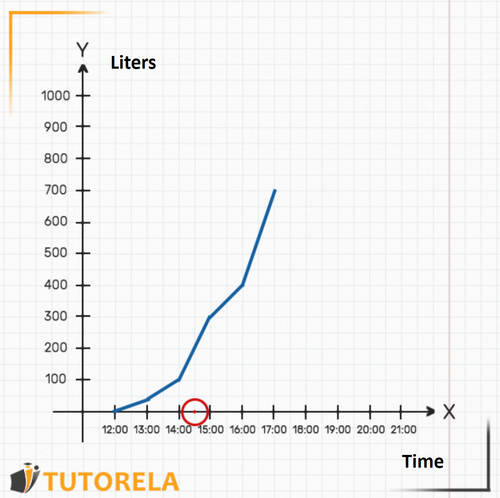
- How much water was in the pool at ?
Let's answer the questions:
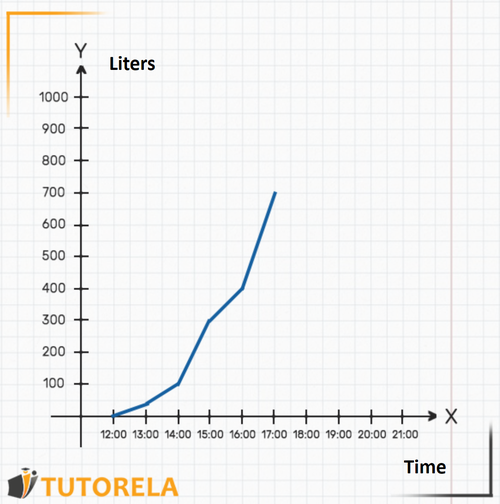
1.To understand how much water was in the pool at sharp, we will look on the axis where the mark is, then, we will see where the graph is on the axis at that time. In this case, we can see that, at there were liters of water in the pool. That is, at that time they began to fill it.
2.To find out when there were exactly liters in the pool we will look on the axis for the mark that indicates 300 liters. We can even place our finger on that point on the axis. Then we will start moving to the right along the axis (moving our finger) until we meet the graph. We will realize that the meeting point with the graph is exactly above the mark (indicated in the following graph). That is, at sharp there were liters of water in the pool exactly.
3.The question asked was how much water was in the pool at ? The time does not appear on the graph, but we know that it is exactly in the middle between and . Clearly, we can deduce where the mark would be seen on the axis.
Now we can find out how much water was in the pool at that time: let's see where the graph is in relation to the axis exactly at the time .
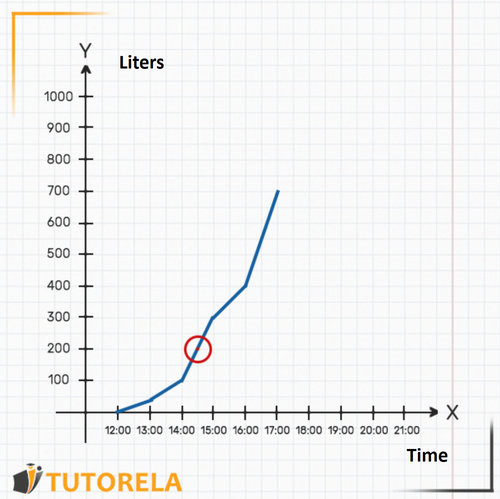
That is, at there were exactly liters of water in the pool.
What does continuous graph mean
In the previous article, we discussed the topic of discrete graphs. In the recent example and in those that follow, we see cases of continuous graphs. What do we mean when we write about a continuous graph?
A continuous graph is a linear graph that describes numerical continuity on the horizontal axis . For example, water filling a pool (the example just seen). The meaning of the word "continuous" is that it has no interruptions, that is, there is a continuity of data. Therefore, we will be able to deduce exactly how much water is in the pool at any given time.
Example 2 - Another example of a continuous graph
A car leaves at from Madrid to Barcelona. Upon arrival, it stops. The graph describes the distance traveled by the car from its starting point.
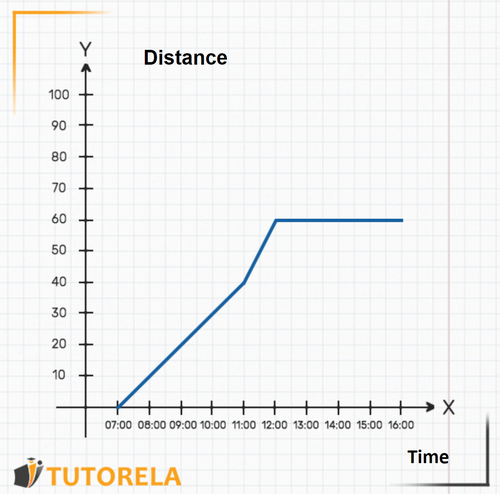
- How far is the car from Madrid at ?
- How far is the car from Madrid at ?
- What time did the car reach its destination?
Solution:
1.To find out the distance between the car and Madrid at we must find the hour on the axis, then we will see where the graph of the function is in relation to that hour on the axis. In this case, the car is exactly away from Madrid
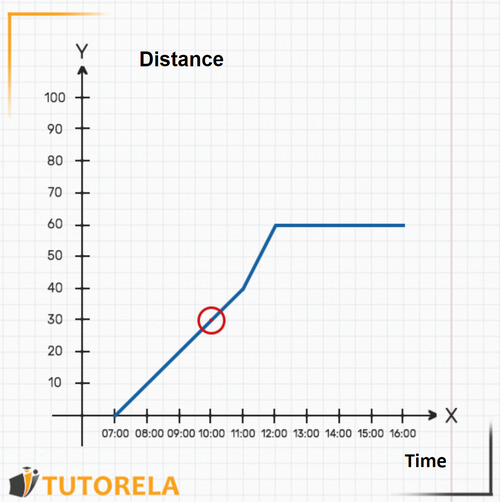
2.The hour is not shown on the graph, but we know it is exactly in the middle between and . We can locate the precise place and find out where the graph is drawn, right at this point, in relation to the axis. We deduce that the car is exactly away from Madrid. This deduction is possible because the graph is continuous.
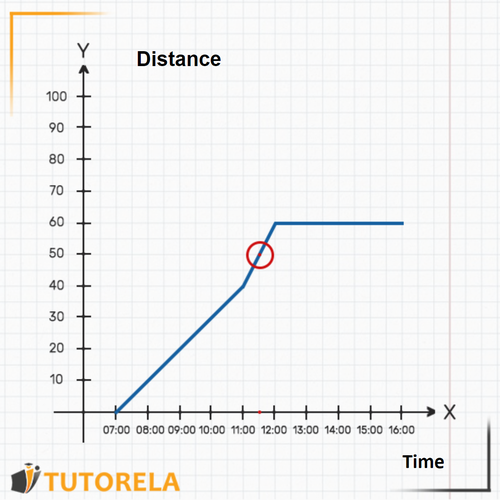
3.What time did the car reach its destination? The arrival time is not explicitly written, however, it has been explained that the car stopped upon arrival. That is, from a certain hour the distance between the car and Madrid should be fixed.
By observing the graph, we will see that, from the car remains at a constant distance from Madrid, . That is, that is the hour at which the car arrived at its destination and stopped. It can be seen that also at and at the car is still away from Madrid.
If you are interested in more information about "graphs" you can find detailed information in the following articles:
Data Collection and Organization - Statistical Research
Reading Information from Graphs
Graphical Representation of a Function
In the blog of Tutorela you will find a variety of articles with interesting explanations about mathematics
- Inequalities
- Inequalities with Absolute Value
- Coordinate System
- Ordered pair
- Graphs
- Reading Graphs
- Value Table
- Discrete graph
- Absolute Value Inequalities
- Numerical Value
- Function
- Linear Function
- Graphs of Direct Proportionality Functions
- Slope in the Function y=mx
- The Linear Function y=mx+b
- Finding a Linear Equation
- Positive and Negativity of a Linear Function
- Representation of Phenomena Using Linear Functions


