Graphs of Direct Proportionality Functions

🏆Practice graphical representation

The graphical representation of a function that represents direct proportionality is actually the ability to express an algebraic expression through a graph.

As it is a direct proportionality, the graph will be of a straight line.

A function that represents direct proportionality is a linear function of the family y=ax+b y=ax+b .

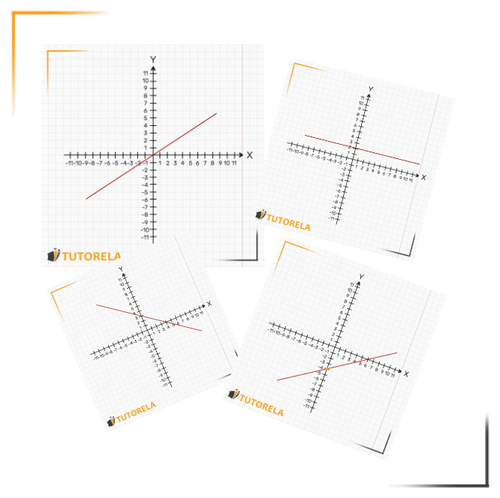
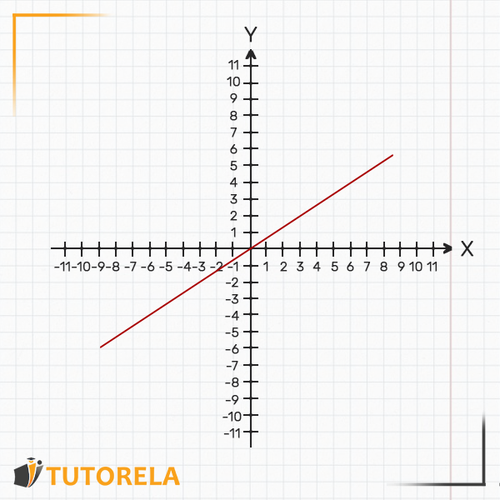
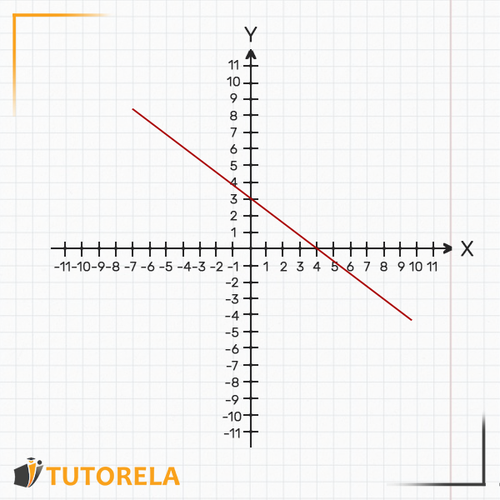
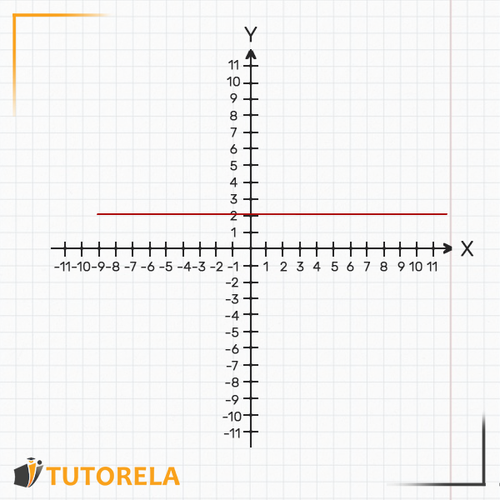
The graphical representation of this function is a straight line that is ascending, descending, or parallel to the X X axis but never parallel to the Y Y axis.

Note: we observe the line from left to right.

We can now recognize in the equation of the line what the graphical representation of each function looks like:

(only when the equation is explicit Y Y is isolated on one side and its coefficient is 1 1 )

A - Graphs of Direct Proportionality Functions

Start practice

Test yourself on graphical representation!

einstein

Which statement is true according to the graph below?

111222333444555666777111222333444555666777888000

Practice more now

A -> the slope of the line

When a>0 a > 0 is positive: the line is ascending

1- When a is positive the line is ascending


When a<0 a < 0 is negative: the line is descending

2 -When a is negative the line is descending


When a=0 a = 0 : the line is parallel to the X X axis

When a = 0 the line is parallel to the X axis


B -> the point of intersection with the Y-axis

b b the y-intercept Y Y

b b indicates at which point the line crosses the Y Y axis.

If b b has a positive coefficient, the line will intersect the positive part of the Y Y axis at the point b b .

If b has a negative coefficient, the line will intersect the negative part of the Y Y axis at the point b b .

If b=0 b=0 , the line will cross the Y Y axis at the origin where Y=0 Y=0 .

To know exactly what the graph of the line's equation looks like, we will have to examine both parameters at the same time, both a and b b .


Join Over 30,000 Students Excelling in Math!
Endless Practice, Expert Guidance - Elevate Your Math Skills Today
Test your knowledge

Examples of Graphical Representation of a Linear Function

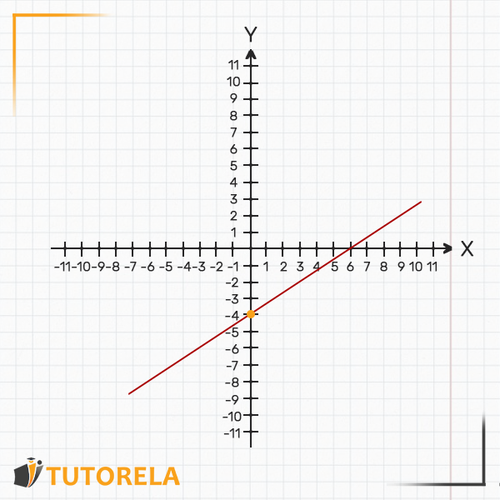
Example 1 (use of the graph)

y=5x4 y=5x-4
We will examine the linear equation.

a=5 a=5 The slope is positive, the line ascends
b=4 b=-4 The line crosses the Y Y axis at the point where Y=4 Y=-4

We will plot the graph based on the data:

We will plot the graph based on the data

Keep in mind that this is just a sketch.

If you want to draw the graph accurately, you can construct a table of values for X X and Y Y and find out the points that form the line.


Example 2 (using the table)

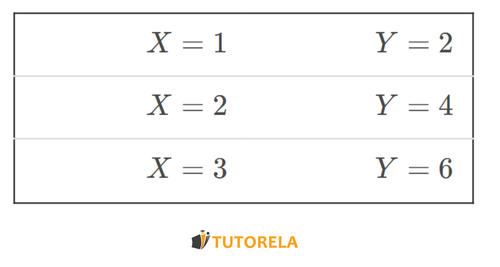
The function y=2X y=2X represents a direct proportionality between the values of X X and Y Y . That is, for each value of X X that we input, the value of Y Y will be double.

We will replace three different values and obtain:

for each value of X that we input, the value of Y will be double

Now let's plot the three points on the coordinate system and connect them. This is actually the graph of the function for y=2X y=2X .


Examples and Exercises with Solutions on Graphical Representation of a Function Representing Direct Proportionality

Exercise #1

Which statement is true according to the graph below?

111222333444555666777111222333444555666777888000

Video Solution

Step-by-Step Solution

If we plot all the points, we'll notice that point (3,5) (3,5) is the correct one, because:

x=3,y=5 x=3,y=5

And they intersect exactly on the line where the graph passes.

Answer

The graph passes through (3,5) (3,5) .

Exercise #2

Choose the correct answer

xy

Step-by-Step Solution

The blue line is a straight line, therefore it remains constant.

Let's note that the red line is rising because it starts in the negative part (negative values) and rises to the positive part (positive values).

Therefore, the correct answer is D.

Answer

Answers B and C are correct

Exercise #3

Does the first graph of the function pass through the origin of the axes?

111222333444555666777–5–5–5–4–4–4–3–3–3–2–2–2–1–1–1111222333000xyIII

Video Solution

Step-by-Step Solution

Let's remember that the origin of the coordinate system is: (0,0) (0,0)

We'll highlight the point on the graph, and note that it doesn't lie on any of the plotted graphs.

Therefore, the answer is C. If we plot the point (3,1) (3,1) , we'll see that it lies on the first graph (the blue one)

Answer

No, it passes through (3,1) (3,1)

Exercise #4

At which point does the graph of the first function (I) intersect the graph of the second function (II)?

111222333444555666777–5–5–5–4–4–4–3–3–3–2–2–2–1–1–1111222333000xyIII

Video Solution

Step-by-Step Solution

Let's pay attention to the point where the lines intersect. We'll mark it.

We'll find that:

X=4,Y=2 X=4,Y=2

Therefore, the point is:

(4,2) (4,2)

Answer

(4,2) (4,2)

Exercise #5

At what point does the graph intersect the x axis?

111222333444555666777–5–5–5–4–4–4–3–3–3–2–2–2–1–1–1111222333000xyII

Video Solution

Step-by-Step Solution

Note that the line intersects only the Y-axis. In other words, it does not touch the X-axis at all.

Therefore, the answer is D.

Answer

Does not cut the axis x

Do you know what the answer is?
Start practice