As we learned in an article on functions, the standard "correspondence rule" is a connection between a dependent variable (Y) (Y) and an independent variable (X) (X) .

By means of a graph or drawing, which gives a visual aspect to the concept of the function. From the graph it is possible to understand whether it is a linear function (straight line), a quadratic function (parabola) and more.

Remember that when it comes to a graphical representation of a function, each point in the domain X X will always have only one point within the range Y Y . Therefore, not every drawing is a graphical representation of a function. Here is an example.
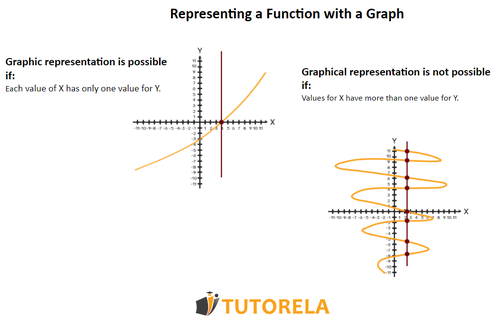
A1 - Graphical representation of a function

Practice Graphical Representation of a Function

Examples with solutions for Graphical Representation of a Function

Exercise #1

Which of the following equations corresponds to the function represented in the graph?

–8–8–8–7–7–7–6–6–6–5–5–5–4–4–4–3–3–3–2–2–2–1–1–1111222333444555666777888–5–5–5–4–4–4–3–3–3–2–2–2–1–1–1111222333444000

Video Solution

Step-by-Step Solution

Use the formula for finding slope:

m=y2y1x2x1 m=\frac{y_2-y_1}{x_2-x_1}

We take the points:

(0,2),(2,0) (0,-2),(-2,0)

m=200(2)= m=\frac{-2-0}{0-(-2)}=

20+2= \frac{-2}{0+2}=

22=1 \frac{-2}{2}=-1

We substitute the point and slope into the line equation:

y=mx+b y=mx+b

0=1×(2)+b 0=-1\times(-2)+b

0=2+b 0=2+b

We combine like terms:

0+(2)=b 0+(-2)=b

2=b -2=b

Therefore, the equation will be:

y=x2 y=-x-2

Answer

y=x2 y=-x-2

Exercise #2

Which of the following equations corresponds to the function represented in the table?

XY-3-1135246810

Video Solution

Step-by-Step Solution

We will use the formula for finding slope:

m=y2y1x2x1 m=\frac{y_2-y_1}{x_2-x_1}

Let's take the points:

(1,4),(3,8) (-1,4),(3,8)

m=843(1)= m=\frac{8-4}{3-(-1)}=

843+1= \frac{8-4}{3+1}=

44=1 \frac{4}{4}=1

We'll substitute the point and slope into the line equation:

y=mx+b y=mx+b

8=1×3+b 8=1\times3+b

8=3+b 8=3+b

Let's combine like terms:

83=b 8-3=b

5=b 5=b

Therefore, the equation will be:

y=x+5 y=x+5

Answer

y=x+5 y=x+5

Exercise #3

Is the given graph a function?

–7–7–7–6–6–6–5–5–5–4–4–4–3–3–3–2–2–2–1–1–1111222333444555666777–4–4–4–3–3–3–2–2–2–1–1–1111222333000

Video Solution

Answer

Yes

Exercise #4

Is the given graph a function?

–7–7–7–6–6–6–5–5–5–4–4–4–3–3–3–2–2–2–1–1–1111222333444555666777–4–4–4–3–3–3–2–2–2–1–1–1111222333000

Video Solution

Answer

No

Exercise #5

Is the given graph a function?

–7–7–7–6–6–6–5–5–5–4–4–4–3–3–3–2–2–2–1–1–1111222333444555666777–4–4–4–3–3–3–2–2–2–1–1–1111222333000

Video Solution

Answer

Yes

Exercise #6

Determine whether the following table represents a function

XY-1015811

Video Solution

Answer

Yes

Exercise #7

Determine whether the following table represents a function

XY02468-3-3-3-3-3

Video Solution

Answer

Yes

Exercise #8

Determine whether the data in the following table represent a constant function

XY012348

Video Solution

Answer

No

Exercise #9

Determine whether the following table represents a function

XY-101247

Video Solution

Answer

No

Exercise #10

Determine whether the following table represents a function

XY-226101416111621

Video Solution

Answer

Yes

Exercise #11

Is the given graph a function?

–7–7–7–6–6–6–5–5–5–4–4–4–3–3–3–2–2–2–1–1–1111222333444555666777–4–4–4–3–3–3–2–2–2–1–1–1111222333000

Video Solution

Answer

No

Exercise #12

Is the given graph a function?

–7–7–7–6–6–6–5–5–5–4–4–4–3–3–3–2–2–2–1–1–1111222333444555666777–4–4–4–3–3–3–2–2–2–1–1–1111222333000

Video Solution

Answer

Yes

Exercise #13

Is the given graph a function?

–7–7–7–6–6–6–5–5–5–4–4–4–3–3–3–2–2–2–1–1–1111222333444555666777–4–4–4–3–3–3–2–2–2–1–1–1111222333000

Video Solution

Answer

No

Exercise #14

Is the given graph a function?

–4–4–4–3–3–3–2–2–2–1–1–1111222333444–2–2–2–1–1–1111222000

Video Solution

Answer

Yes

Exercise #15

Which of the following equations corresponds to the function represented in the table?

XY-125811246810

Video Solution

Answer

y=23x+223 y=\frac{2}{3}x+2\frac{2}{3}

Topics learned in later sections

  1. Ways to Represent a Function
  2. Representing a Function Verbally and with Tables
  3. Algebraic Representation of a Function
  4. Notation of a Function
  5. Rate of Change of a Function
  6. Variation of a Function
  7. Rate of change represented with steps in the graph of the function
  8. Rate of change of a function represented graphically
  9. Constant Rate of Change
  10. Variable Rate of Change
  11. Rate of Change of a Function Represented by a Table of Values
  12. Functions for Seventh Grade
  13. Increasing and Decreasing Intervals (Functions)
  14. Increasing functions
  15. Decreasing function
  16. Constant Function
  17. Decreasing Interval of a function
  18. Increasing Intervals of a function
  19. Domain of a Function
  20. Indefinite integral
  21. Inputing Values into a Function