Increasing and Decreasing Function Intervals Practice Problems

Master identifying increasing, decreasing, and constant function intervals with step-by-step practice problems. Build confidence in analyzing function behavior.

📚What You'll Master in This Practice Session
  • Identify increasing intervals where both X and Y values rise together
  • Find decreasing intervals where X increases while Y decreases
  • Recognize constant function intervals with unchanging Y values
  • Use vertex formulas to determine parabola increasing and decreasing regions
  • Analyze graphs to locate exact interval boundaries using X-axis values
  • Apply interval notation correctly for mathematical communication

Understanding Increasing and Decreasing Intervals of a Function

Complete explanation with examples

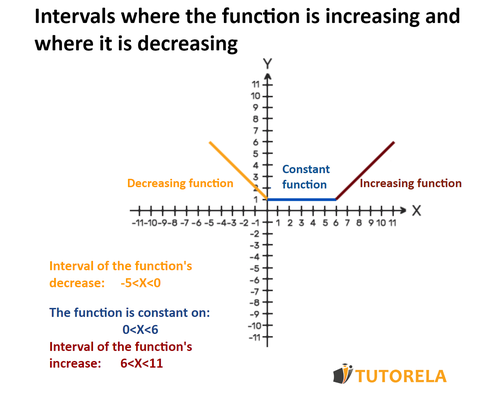
The intervals where the function is increasing show a certain situation in which the values of X X and Y Y increase together. 

The intervals where the function is decreasing expose a certain situation in which the value of X X in a function increases while that of Y Y decreases. 

I1 - intervals with colors where the function is increasing and where it is decreasing

Detailed explanation

Practice Increasing and Decreasing Intervals of a Function

Test your knowledge with 17 quizzes

Which domain corresponds to the described function:

The function represents the velocity of a stone after being dropped from a great height as a function of time.

Examples with solutions for Increasing and Decreasing Intervals of a Function

Step-by-step solutions included
Exercise #1

Is the function shown in the graph below decreasing?

yx

Step-by-Step Solution

To solve this problem, we'll follow these steps:

  • Step 1: Visually inspect the graph to see if it is consistently sloping downward.
  • Step 2: Apply the definition of a decreasing function.

Now, let's work through each step:
Step 1: Observing the graph, the function's graph is a line moving from the top left to the bottom right. This indicates it slopes downward as we move from left to right across the x x -axis.
Step 2: According to the definition of a decreasing function, for any x1<x2 x_1 < x_2 , it must hold true that f(x1)>f(x2) f(x_1) > f(x_2) . Since the graph shows a line moving downward, this condition is satisfied throughout its domain.

Therefore, the function represented by the graph is indeed decreasing.

The final answer is Yes.

Answer:

Yes

Exercise #2

Is the function in the graph decreasing?

yx

Step-by-Step Solution

To analyze whether the function in the graph is decreasing, we must understand how the function's behavior is defined by its graph:

  • Step 1: Examine the graph. The graph presented is a horizontal line.
  • Step 2: Recognize the properties of a horizontal line. Horizontally aligned lines correspond to constant functions because the y y -value remains the same for all x x -values.
  • Step 3: Define the criteria for a function to be decreasing. A function decreases when, as x x increases, the value of f(x) f(x) decreases.
  • Step 4: Apply this criterion to the horizontal line. Since the y y -value is constant and does not decrease as x x moves rightward, the function is not decreasing.

Therefore, the function represented by the graph is not decreasing.

Answer:

No

Exercise #3

In what domain is the function increasing?

–5–5–5555101010151515–5–5–5555000

Step-by-Step Solution

Let's first remember that a function is increasing if both the X and Y values are increasing simultaneously.

Conversely, a function is decreasing if the X values are increasing while the Y values are decreasing simultaneously.

In the graph shown, we can see that the function is increasing in every domain and therefore the function is increasing for all values of X.

Answer:

All values of x x

Video Solution
Exercise #4

In what interval is the function increasing?

Purple line: x=0.6 x=0.6

111222333111000

Step-by-Step Solution

Let's remember that a function is described as increasing if both X values and Y values are increasing simultaneously.

A function is decreasing if X values are increasing while Y values are decreasing simultaneously.

In the graph, we can see that in the domain x<0.6 x < 0.6 the function is increasing, meaning the Y values are increasing.

Answer:

x<0.6 x<0.6

Video Solution
Exercise #5

Determine in which domain the function is negative?

–0.5–0.5–0.50.50.50.51111.51.51.5222000

Step-by-Step Solution

Remember that a function is increasing if both X values and Y values are increasing simultaneously.

A function is decreasing if X values are increasing while Y values are decreasing simultaneously.

In the graph, we can observe that in the domain x>1 x > 1 the function is decreasing, meaning the Y values are decreasing.

Answer:

x>1 x > 1

Video Solution

Frequently Asked Questions

How do you find increasing and decreasing intervals of a function?

+
Look at the graph and identify where the function rises (increasing) or falls (decreasing) as you move from left to right. Mark the X-axis values where the function changes direction to find interval boundaries.

What does it mean when a function is increasing?

+
A function is increasing when both X and Y values grow together. Visually, the graph line moves upward as you read from left to right, showing positive slope.

How do you write interval notation for increasing functions?

+
Use inequality symbols like X < -3 or 0 < X < 3. For open intervals, use parentheses (a,b). For closed intervals including endpoints, use brackets [a,b].

What is the difference between increasing and decreasing intervals?

+
In increasing intervals, Y values rise as X increases (graph goes up). In decreasing intervals, Y values fall as X increases (graph goes down). Constant intervals show no change in Y values.

How do you find the vertex of a parabola to determine intervals?

+
Use the formula x = -b/(2a) where a and b come from f(x) = ax² + bx + c. The vertex X-coordinate divides the parabola into increasing and decreasing regions.

Can a function have multiple increasing intervals?

+
Yes, functions can have several increasing and decreasing intervals. Complex functions may alternate between increasing, decreasing, and constant regions multiple times across their domain.

What happens at the boundary points between intervals?

+
Boundary points are where the function changes from increasing to decreasing (or vice versa). These are often maximum or minimum points, also called critical points or turning points.

How do you identify constant function intervals?

+
Constant intervals appear as horizontal lines on the graph where Y values remain the same while X values change. The function neither increases nor decreases in these regions.

More Increasing and Decreasing Intervals of a Function Questions

Continue Your Math Journey

Practice by Question Type