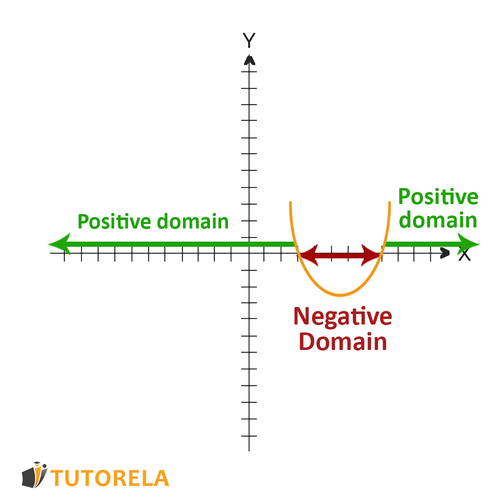
To solve this problem, we need to determine when f(x) is negative by analyzing the graph provided.
The graph shows a quadratic function shaped as a parabola. Importantly, the parabola intersects the x-axis precisely at point A, which is its vertex. From this, we can deduce two possible scenarios:
1. If the parabola opens upwards (convex), the vertex represents the minimum point. Thus, the y-value at the vertex is greater than any other point on the function, implying there is no region where f(x)<0 since the lowest point is zero.
2. If it were to open downwards, point A would be the maximum, and f(x) could be negative elsewhere, but this contradicts the given information that point A is a vertex on the x-axis, suggesting the opening is upwards.
Since the graph passes through the x-axis only at vertex A and that is the minimum point, the parabola opens upwards. Therefore, the function f(x) never takes negative values as it only touches the x-axis without crossing it.
Thus, the conclusion is that there are no values of x for which f(x)<0.
Hence, the function has no negative domain.
Answer:
The function has no negative domain.
