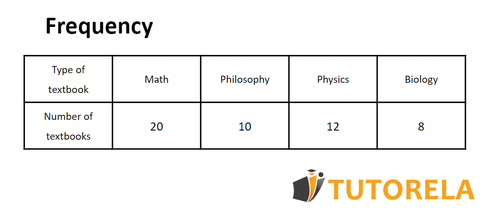
Below is a table illustrating the distribution of study books according to subject. There are a total of 50 study books.
We are asked to find the most frequent type of study books. How many times does it appear?
Let's look at the table, and it appears that the most frequent type of study book is math books. 20 study books are math books.
Coral bought three pants at the following prices: $150, $80 and $100.
We are asked to calculate the average price Coral paid for a pair of pants.
Calculate the average price by applying the rule we learned about calculating averages: divide the sum of all the data by the number of data.
The sum of all the data is: 150+80+100=330$.
The number of data is 3 (a total of 3 pants).
Now we get: average =3330=110$.
That is, the average price Coral paid for a pair of pants is $110. You can see that the average itself does not appear at all in the data list.
List of data:
10,30,50,70,90
We must find the median.
This is a list of numbers sorted in ascending order (otherwise we would have to sort them ourselves).
The number 50 is in a central position, since we refer to an odd number of elements (50).
Therefore, the median is 50.
List of data:
10,30,50,70,90,110
We must find the median.
This is a list of numbers sorted in ascending order (otherwise we would have to sort them ourselves).
This time we refer to an even number of elements (6), so we have two main elements: 50 and 70.
To calculate the median, we must calculate the average of the two central numbers.
We obtain: median =2(50+70)=2120=60
That is, in this case the median is 60.
It is important to note that the median does not have to be one of the data in the list.


