Data Collection and Organization
Data collection in statistics involves gathering information to answer questions or make predictions. Organizing data helps ensure accuracy and accessibility, essential for meaningful analysis.
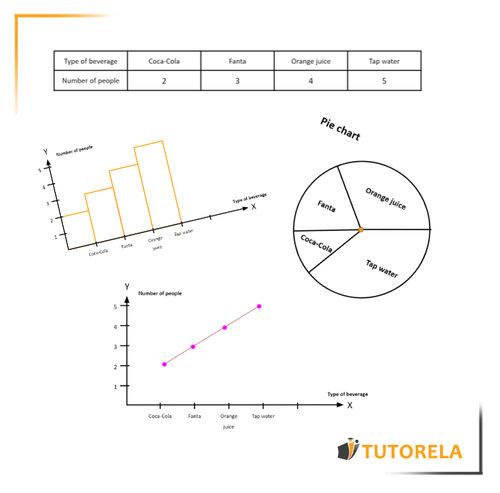
There are many ways to express numerical information, the presentation of numerical information in graphical form can vary according to the needs of the person using the information.
For example: using a pie chart emphasizes the relative part of each parameter of the whole, a chart with a line emphasizes the difference between the parts, and sometimes a standard list is the quickest and easiest way to convey what we want to convey. Just like the grocery shopping list at the store.

Data can be organized and compiled in the following ways:
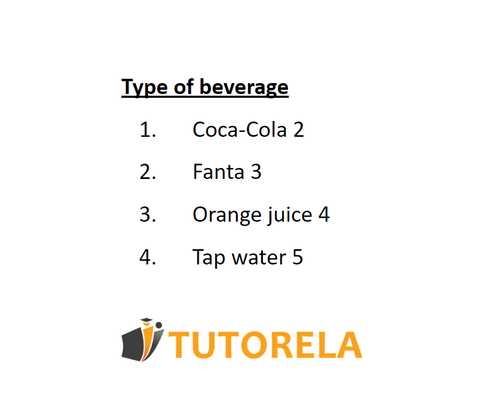
- Data List - Refers to a simple list of data, including numbers, values and more.
- Table - Data can be organized in a table that includes columns and rows.
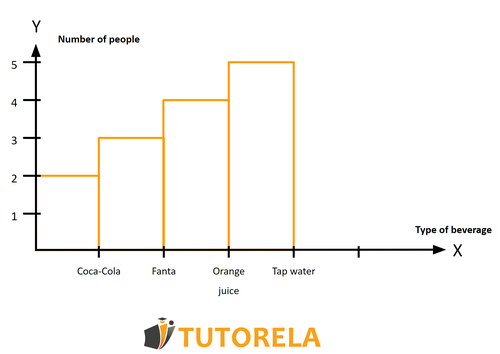
- Bar chart (rectangular plot) - where the height of the columns represents the value we want to calculate.
- Pie chart - where each part is represented in a part of the circle.
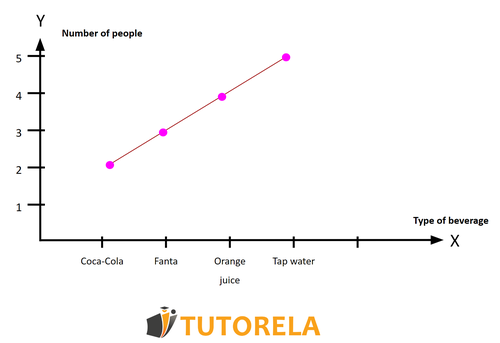
- Graph - each value is represented by a point on the graph.


